
A small conference room overlooking a pine forest.
Markers, a stack of paper, and 25 faces.
I had been dreaming of joining this course for five years. Five years during which I used visuals in education almost daily – from quick flipchart sketches to carefully designed visual outlines for workshops. I saw myself improving with each new flipchart, yet I still craved more – not just inspiration from afar, but a whole week immersed in drawing, testing, and experimenting.
I’ve known one of the trainers, Helena, for years – she’s the one who first introduced me to graphic facilitation. The other, Ula, I met two years ago at a fundraising course. Together, they make a perfectly balanced duo.
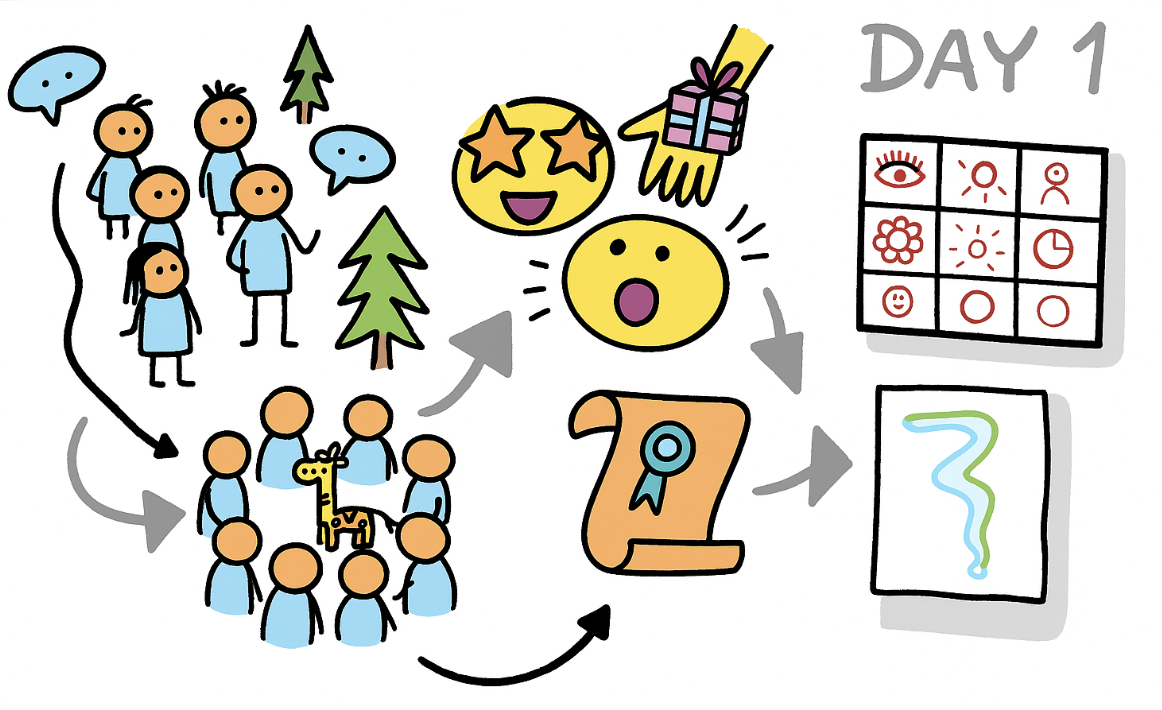
Day 1 – First lines
We started gently: getting to know the space, the people, and the program, breaking the ice, sharing expectations, agreeing on rules. And then our first challenge – the 30 Circles activity. Thirty blank circles and three minutes to turn them into as many drawings as possible. Some went for quantity, others for quality. Some peeked at their neighbors for inspiration; others forbade themselves to even glance sideways.
The discussion that followed – about inspiration vs. copying – reminded us that in graphic facilitation, it’s perfectly fine to borrow elements that already work.
Another exercise: drawing part of an image and letting someone else finish it. Right from the start, we learned not to cling to our creations – someone might “ruin” or change them, and the outcome won’t always match our vision. I knew this skill – letting someone touch “my” work – would serve me well not only here but back at my job too. And, throughout the week, I noticed how much it still bothered me when a final flipchart didn’t look exactly how I imagined.
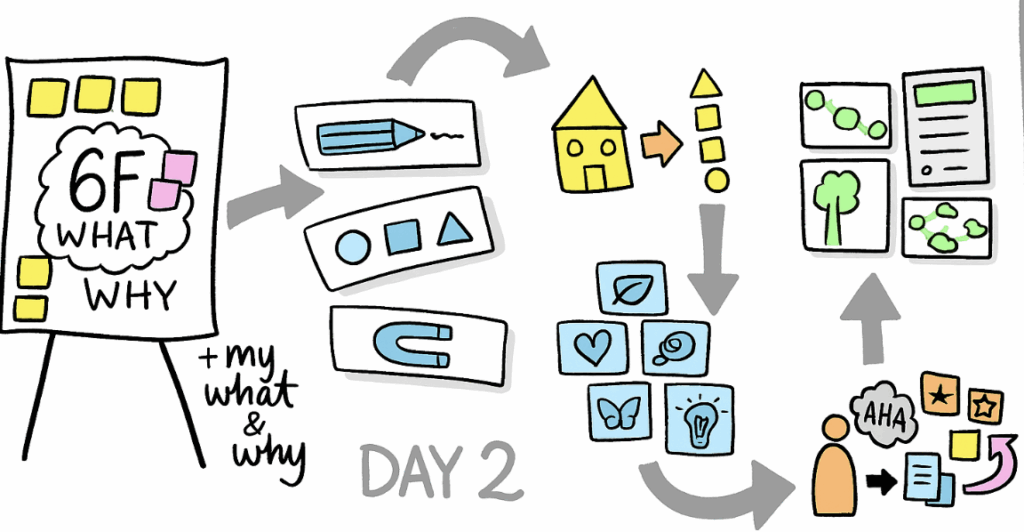
Day 2 – What is graphic facilitation, really?
We dove straight into the core question: What actually is graphic facilitation? We spent a lot of time exploring definitions, sharing perspectives, and piecing together our shared what and why.
Graphic facilitation is a method that turns content into a visual form using symbols, icons, and simple graphic elements. It helps present ideas, information, and concepts clearly and understandably.
It’s a blend of visual thinking and facilitation – guiding a group toward its goal through colors, diagrams, and hand-drawn elements.
Then we moved on to the principles that hold it all together: preparation, simplification, visual appeal, cultural sensitivity, readability, clear messaging, and embracing mistakes as part of the process. We practiced building (and breaking down) drawings from basic shapes – triangles, rectangles, circles. We tried creating icons for various themes, noticing how one concept could have ten different visual interpretations. In the afternoon, we worked on our first visual vocabulary and touched on templates – how to structure a flipchart so it flows logically and is pleasant to look at.
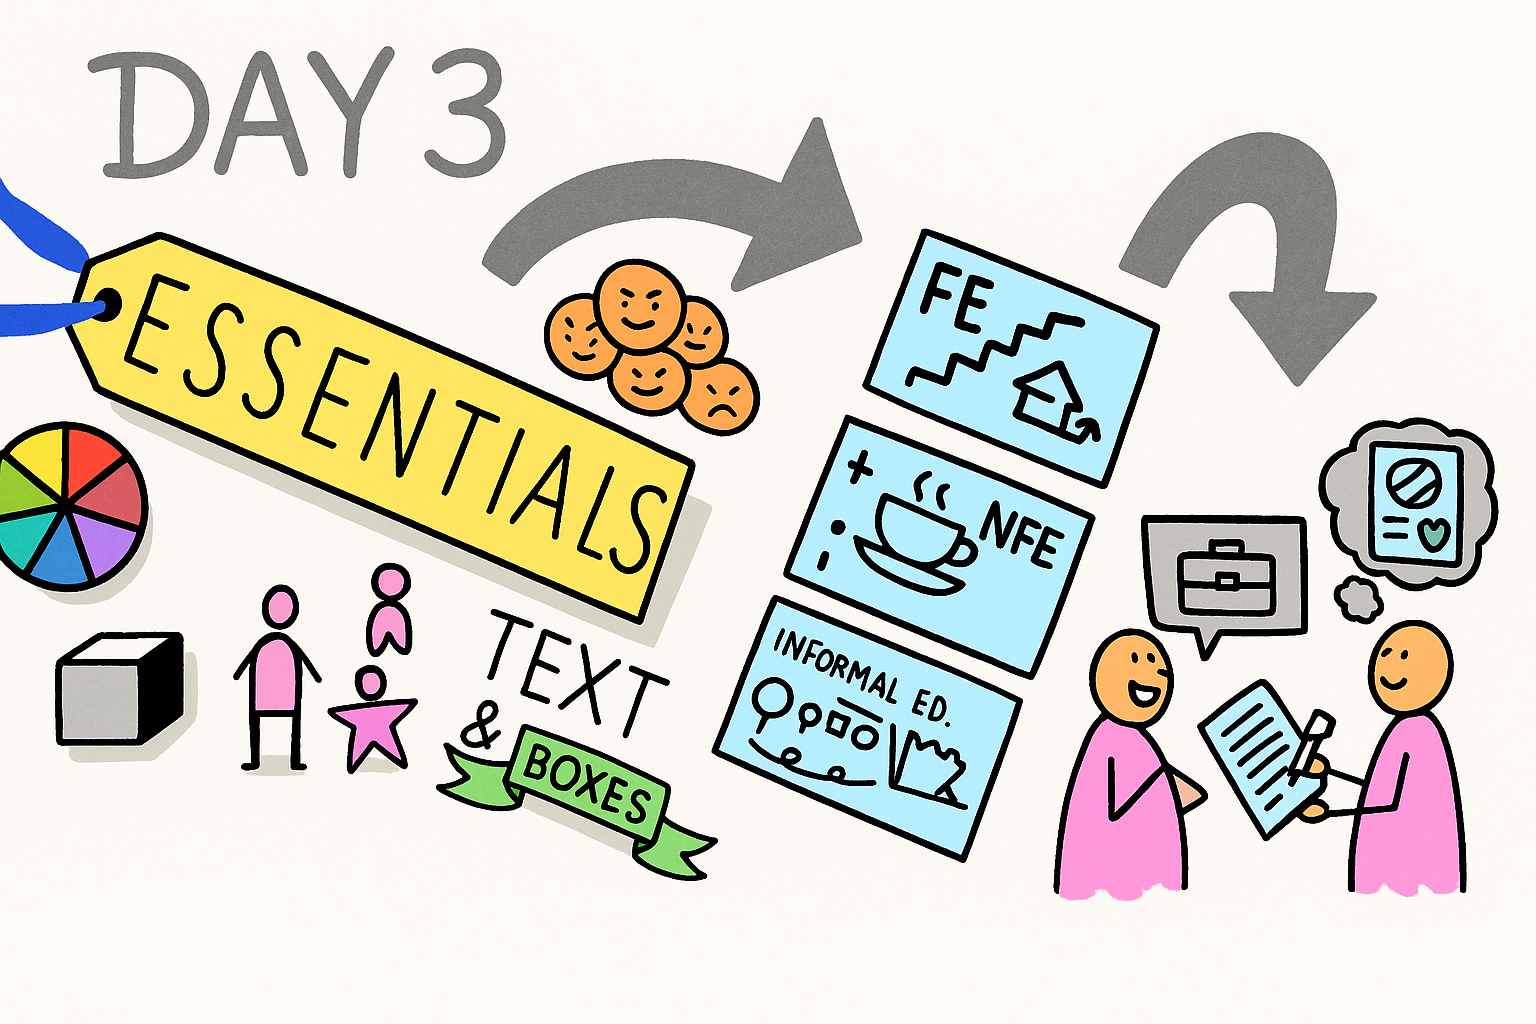
Day 3 – The essentials
Building blocks: colors, shapes, characters, emotions, lettering, frames, and connectors. With colors, we didn’t just talk about the color wheel but also how colors work together and affect readability and mood. We simplified characters into just a few strokes and explored how a tiny change in a line’s angle can completely change an emotion.
In small groups, we were given a topic to present visually on a flipchart while speaking to the rest of the group. For me, this was probably the most frustrating part – a group flipchart will never look exactly the way you envision it.
We ended the day with a professional interview: in pairs, we interviewed each other about our work stories and created a visual “CV” for our partner. It was a surprisingly nice blend of creative work and getting to know each other.
Day 4 – Letting it sink in
After three days of intense drawing, we had a “day off” – though not entirely. It was more about giving our minds and hands a break so everything could settle. I spent some time on work tasks, but most of the day went into talking with other participants – many of them were trainers too, and we exchanged stories, experiences, and ethical dilemmas.
Even without a flipchart in front of me, inspiration kept flowing – just at a slower pace.
Why graphic facilitation is powerful:
- Helps people understand and remember information faster
- Increases focus and engagement
- Makes complex topics easier to grasp and connections easier to see
- Structures content and clarifies key messages
- Makes content more attractive, fun, and enjoyable to follow
- Breaks down barriers, creates a more relaxed atmosphere
- Overcomes language barriers, understandable across cultures and ages
- Sparks creativity and collaboration
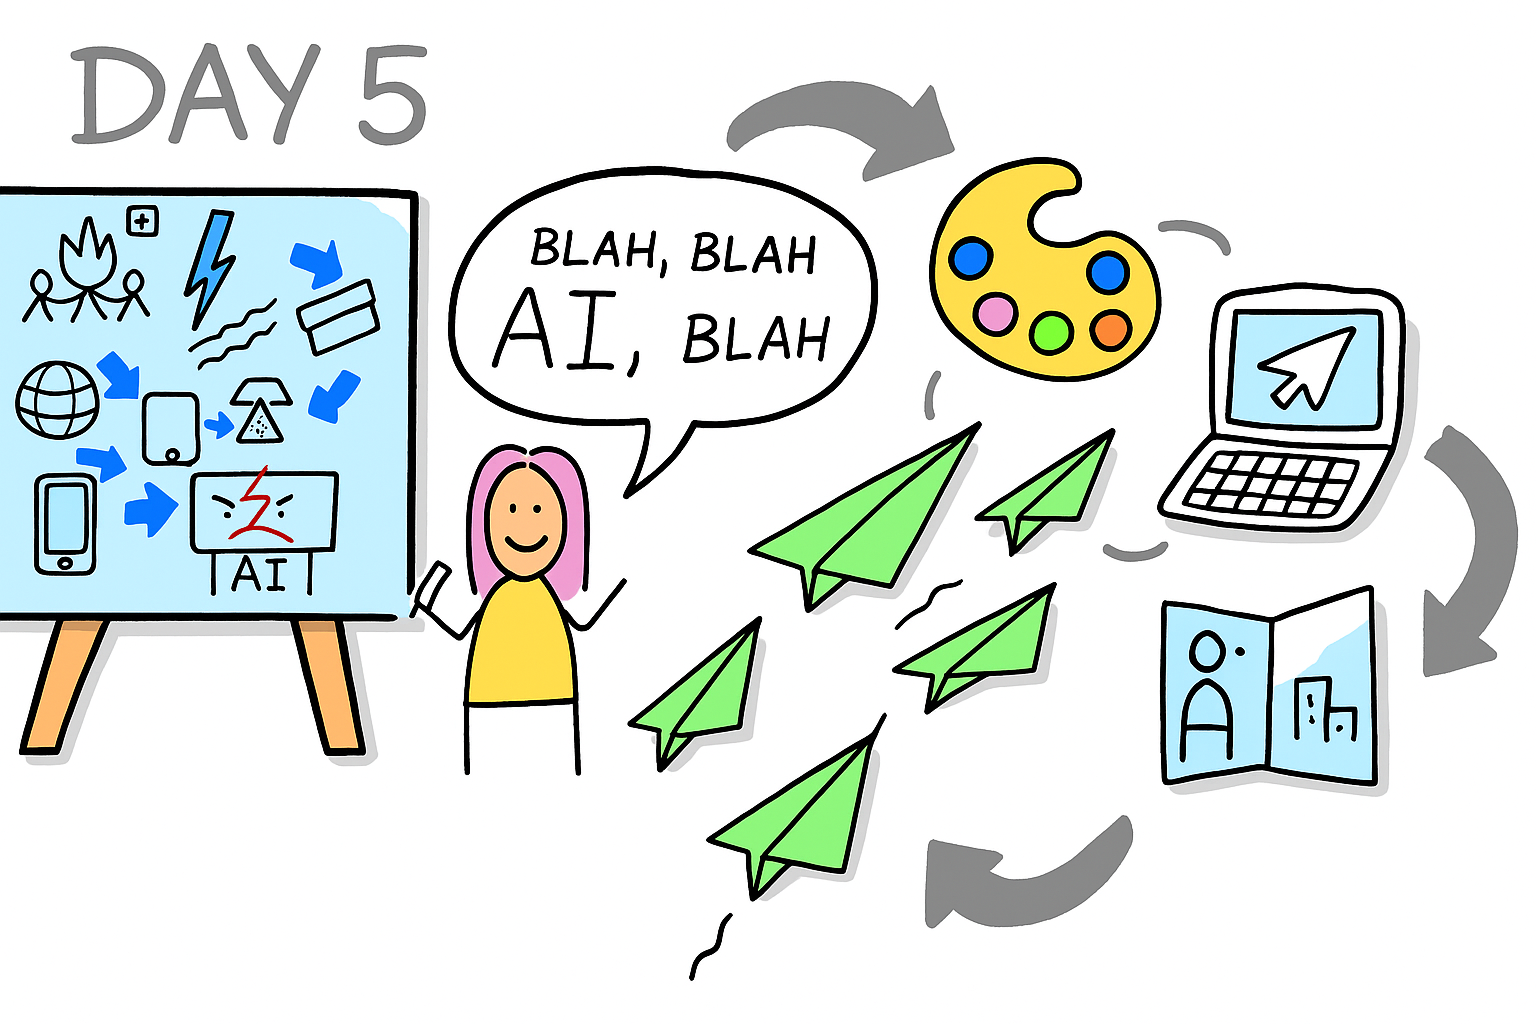
Day 5 – From personal topic to visual vocabulary
We started the day with an assignment: prepare a 10-minute presentation on a topic close to our hearts. I chose artificial intelligence from a historical perspective – exploring whether AI is more of a threat or a benefit, framed within the story of past technological revolutions.
The morning went into refining the narrative, finding simple visuals, and thinking about what would work while talking and drawing at the same time. When it came time to present in small groups, I quickly realized that what looked clear and neat on my A4 prep sheet could easily fall apart on a large flipchart hanging on the wall.
The afternoon was self-directed learning space:
- Challenge station – quick-fire exercises for speed, variation, and creativity: write the word “love” so that the lettering itself shows the meaning; draw the same character in 25 different situations; create 30 variations of a star, getting faster each time.
- Art station – colors, natural materials, and free creation without judgment, just for the joy of making.
- Digital station – tools and tips for bringing visual facilitation into the online space.
We ended the evening by creating our own visual vocabulary – icons meaningful for our contexts, topics we teach, situations we face, projects we live. We also received one-on-one feedback on our work.
Day 6 – Swan-like calm, adrenaline in the hand
The morning was all about graphic recording – drawing while someone else speaks. Unlike facilitation, you don’t have your own script; you listen in real time and try to capture the essence of what you hear. We saw examples from conferences, then tried it ourselves: first with a TED Talk (twice, simplifying the second time), then with a free-flowing discussion with no clear points.
In the afternoon, we learned the swan metaphor – calm on the surface, fast paddling underneath. A facilitator should appear confident outwardly while making quick decisions inside about what to capture and how.
We tested it live: new TED Talk, only once, no stopping. Then the adrenaline challenge – a presentation on a random topic, drawn instantly on the flipchart while speaking in sync.
We ended the day with a reflection – each of us drew our “river of the week” with calm stretches and rapids.
Day 7 – The closing
The last day was mostly formal but still important. The morning was for networking – everyone presented their organization and current projects. Then we explored more opportunities through Erasmus+ and discussed where our new skills could lead us.
We wrapped up with final course evaluations, feedback for the trainers and each other, and tying up loose ends. And finally, goodbyes – to the people with whom we’d spent a week not just drawing, but sharing dozens of small “aha” moments.
So what?
At the beginning, I was a bit unsure whether I would still have something new to learn – and I quickly realized that I definitely did. The real work starts now, after the training, when I begin practicing everything in real situations.
What really surprised me was how challenging it is to stand in front of a flipchart and draw live. Preparing flipcharts in advance already feels quite easy to me. But improvising on the spot, drawing while speaking in a way that doesn’t disturb the flow but feels natural – that’s still a big challenge for me.
On the other hand, I completely fell in love with graphic recording. I didn’t expect it, but I found it incredibly fun and surprisingly natural – and it’s definitely something I would love to develop further.
This whole experience also had a very personal layer for me. Helena was there at the very beginning of my journey with graphic facilitation, and also at the start of my path as a trainer many years ago. For me, she was strongly connected with the nonprofit sector, where I spent most of my career so far. And now, as I’ve started a new job that marks the beginning of a different chapter, it felt symbolic that this project somehow closed one era of my professional life.
At the same time, I truly hope to bring graphic facilitation and graphic recording into my new role – whether in my current job or through freelance work. Because it really is a powerful tool, and one I’d love to continue improving in.